Charting the Future: Sales Forecasting by Region
by Joyce Mirador
Unlocking future sales through data-driven insights is the purpose of this project. In an ever-evolving industry, predicting future sales is crucial for maintaining a competitive edge. By analyzing a comprehensive sales dataset, we delve into the intricacies of sales patterns across different regions.
Objectives
The primary objective is to forecast future sales for different regions to enhance strategic planning, resource allocation, and inventory management. Understanding sales trends and predicting future sales will enable data-driven decisions to maximize profits and minimize costs.
⃟⃟⃟
Data Preparation
The dataset, a Tableau sample data, contains information about products, sales, and profits within a fictitious company from 2019 to 2022, including key columns such as order_id, order_date, ship_mode, segment, state, region, product_id, category, sub_category, sales, quantity, discount, and profit. It has 13 columns and 9994 rows, with no null values but some duplicated rows removed using Python. In addition, data type conversion was performed, particularly converting order_date to datetime format. Descriptive statistics revealed a total of 5009 orders and 1862 unique products sold.
⃟⃟⃟
Data Visualization
Sales Trend Over Time
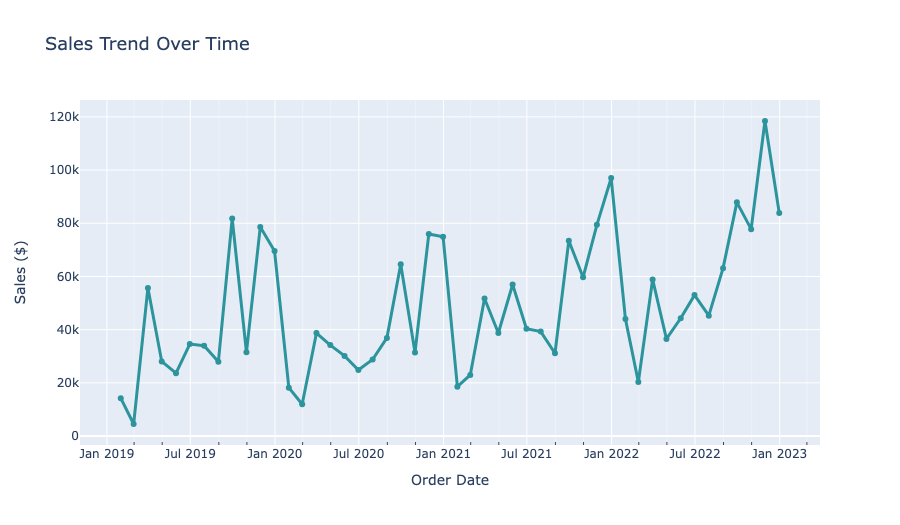
Sales decrease during the first months of the year and increase towards the end of the year.
Regional Sales Trend
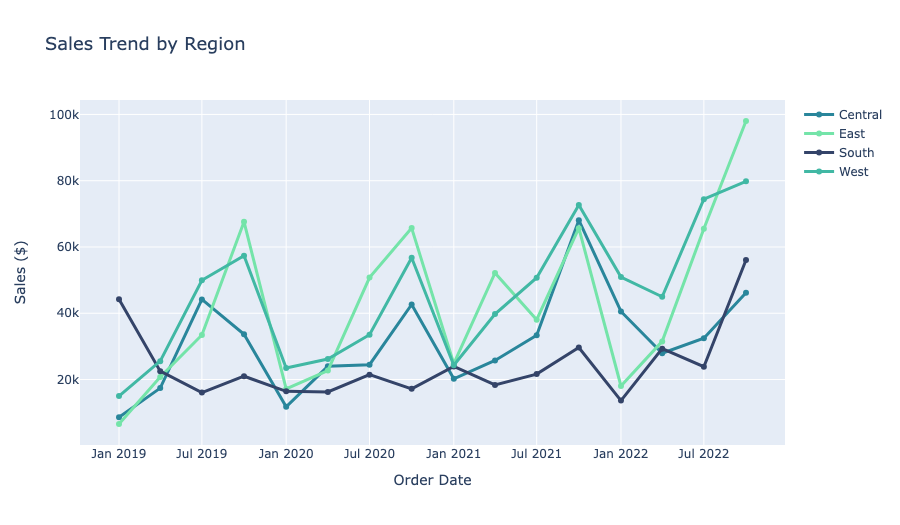
Southern region starts with the highest sales but decreases over time. Central and Western regions show similar patterns, with the Western region having higher sales. All regions, except the Southern region, exhibit lower sales during the first months of the year.
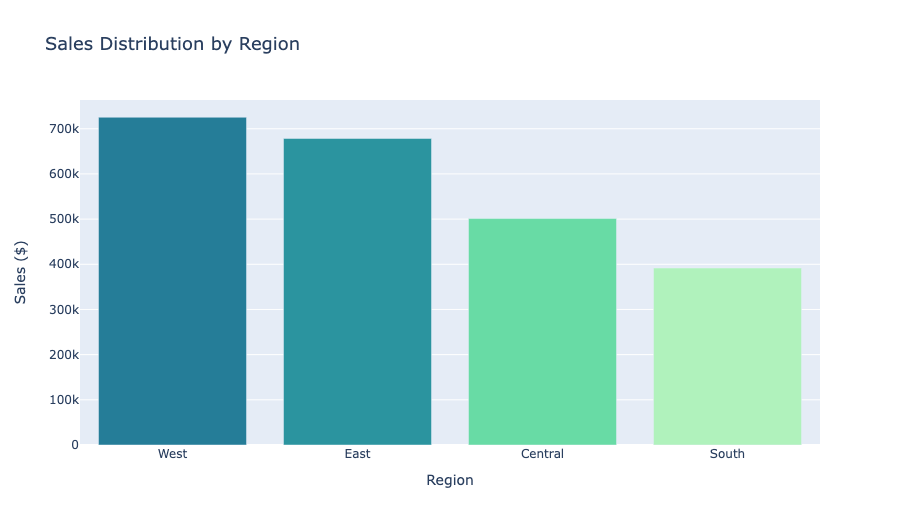
Sales Distribution by Region
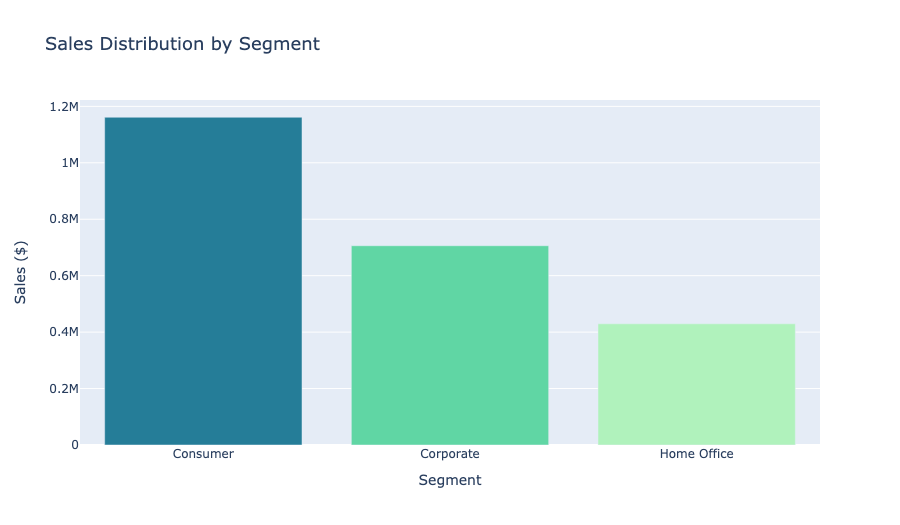
Sales Distribution by Segment
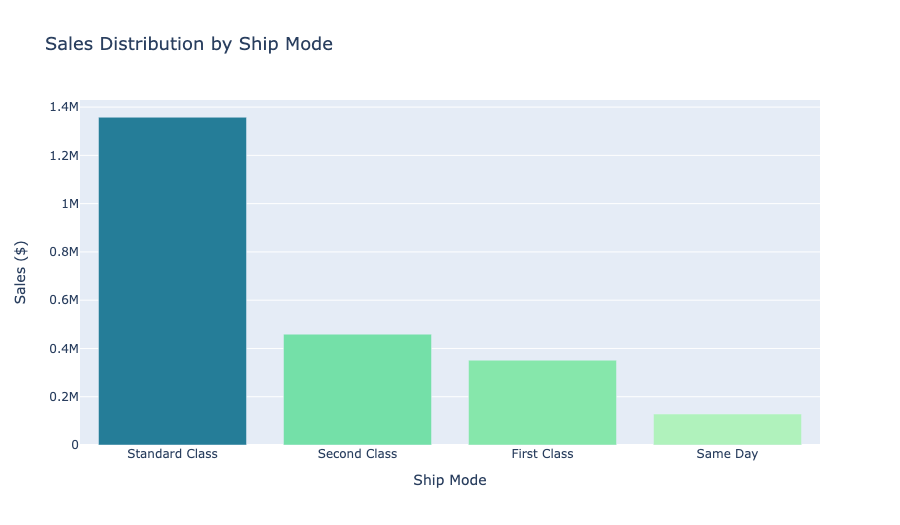
Sales Distribution by Ship Mode
Sales by Product Category and Sub-Category
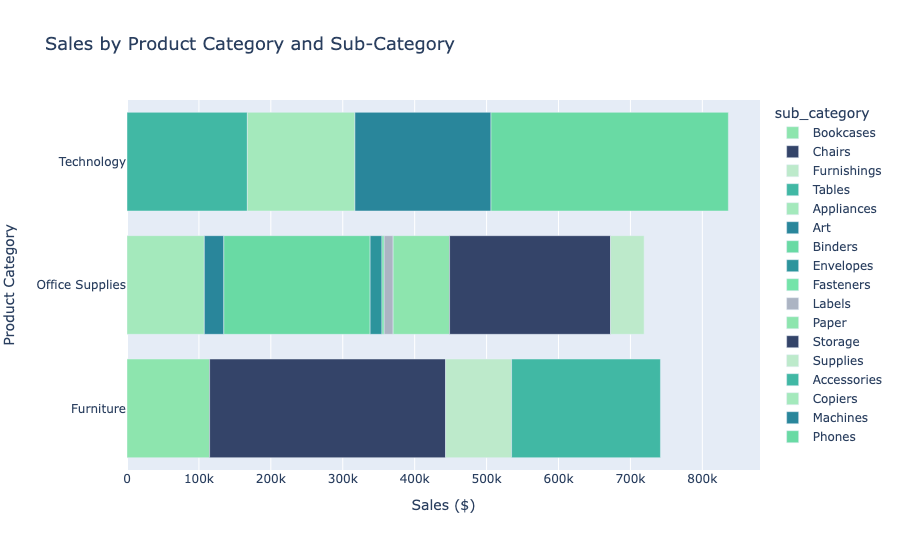
Technology category has the most sales, with Phones as the top sub-category. The top 5 sub-categories: Phones, Chairs, Storage, Tables, Binders.
Sales and Profit Analysis
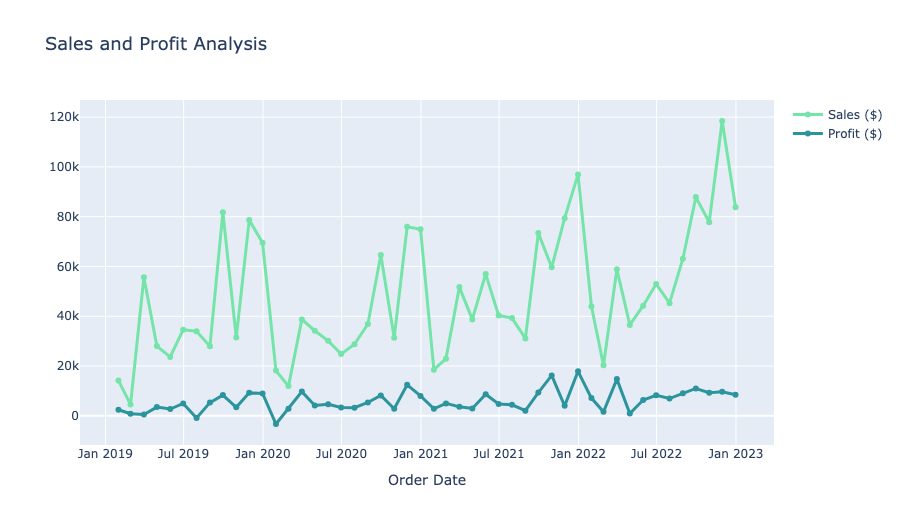
Profit generally follows sales trends but does not show spikes compared to sales. From August 2022, profit stagnated compared to sales.
Sales and Discount Analysis
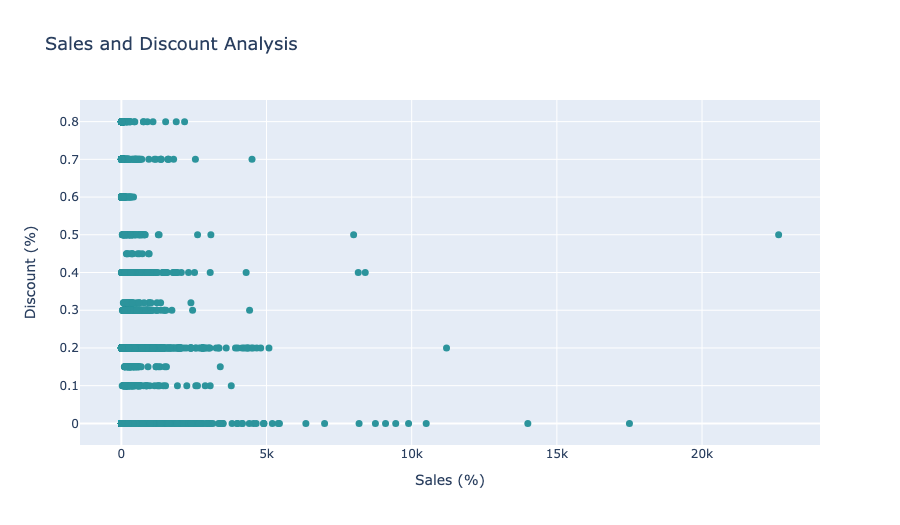
Higher discounts do not necessarily result in higher sales.
Correlation Matrix
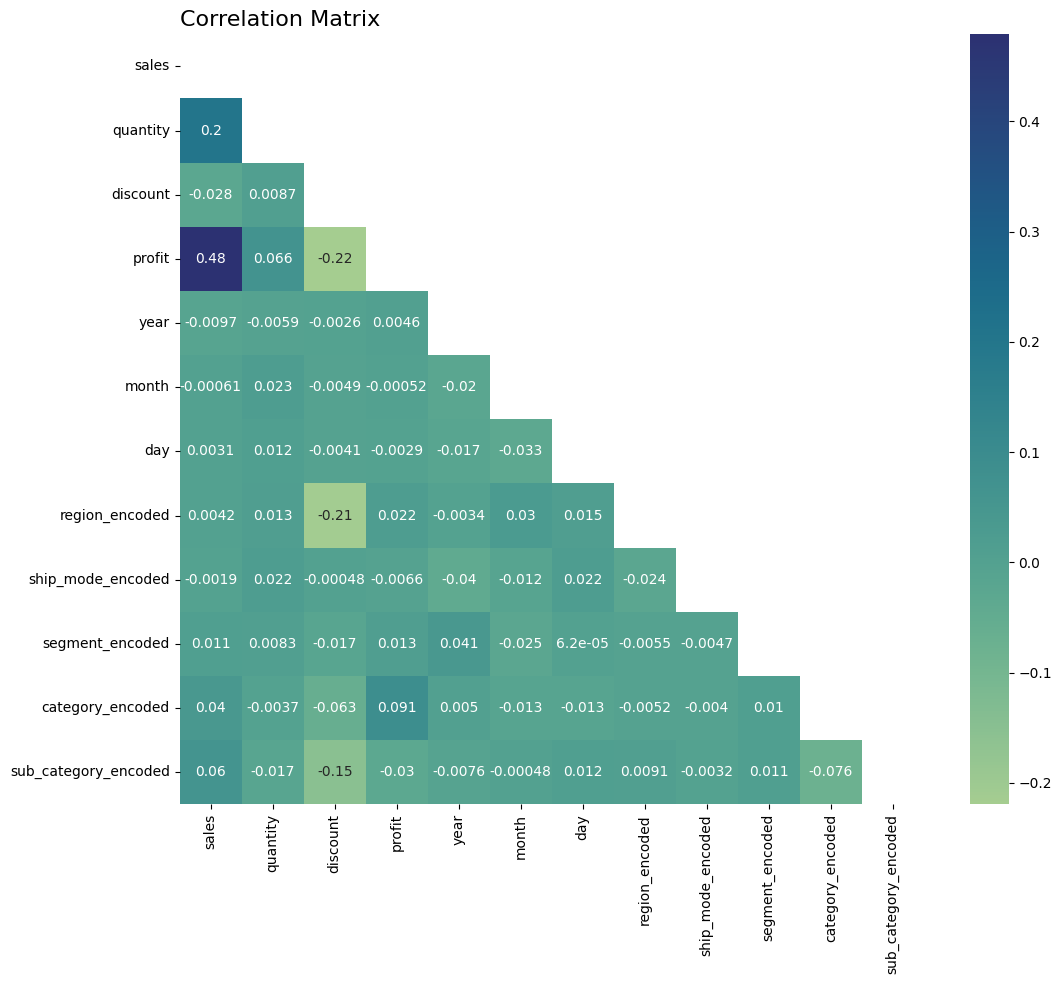
Sales have a positive relationship with profit and quantities sold, indicating that increasing sales volume directly boosts profitability. There is a weaker positive relationship with customer segments, product categories, and sub-categories, suggesting targeted strategies can enhance sales incrementally. Discounts have a negative relationship with sales and profit, emphasizing the need for minimal discounting to maintain profitability. The order date shows minimal impact on sales, highlighting that other factors play a more significant role in shaping sales trends. It highlights the importance of strategic sales management beyond temporal fluctuations.
⃟⃟⃟
Analysis Results
Multivariable Regression Analysis
Ridge regression effectively addressed overfitting by creating region-specific models with key interaction features. Sales consistently showed a positive relationship with quantities sold across all regions. Lagging/date features were crucial for capturing sales trends, while standalone date and dataset features contributed to overfitting. In the South, higher discounts led to lower sales, whereas the East and Central regions saw higher discounts correlate with increased sales. The West region outperformed with the highest sales, followed by the East, Central, and South regions, highlighting distinct market dynamics.
Key Findings:- Sales positively correlate with quantities sold for all regions, indicating that more items sold lead to higher sales.
- Interaction features and lagging/date features are crucial for capturing sales trends, emphasizing the importance of combining these features with original dataset features for a better-fit model.
- Discounts show varying effects on sales across different regions.
- The West region leads in sales, followed by East, Central, and South regions.
- The Consumer segment and Standard class shipping mode have the highest sales.
- The technology category, particularly Phones, dominates sales.
- Profit trends align with sales trends but show no significant spikes compared to sales. From August 2022, profit stagnated compared to sales.
⃟⃟⃟
Recommendations
- Model Improvement: Enhance the ridge regression model by optimizing interaction features and consider using advanced machine learning models like ARIMA or LSTM for improved forecasting. Collect more data if the goal is to explore relationships between sales and factors like shipping, categories, and customer segments.
- Data Enhancement: Focus on the West region for strategic growth due to its highest sales performance and optimize discount strategies for the East and Central regions to boost sales. Allocate more resources to the Consumer segment and Standard class shipping mode for maximum sales impact, prioritizing technology products, especially Phones, for inventory management and marketing efforts.
- Operational Use: Adjust inventory levels based on seasonal sales trends, with higher stock towards the end of the year. Monitor and adjust discount strategies to avoid negative impacts on sales and profit. Use yearly historical data for better forecasting results, emphasizing the importance of lagging and date features.
ദ്ദി(˵ •̀ ᴗ - ˵ ) ✧