E-Commerce Sales Analysis: Understanding Olist’s Performance and Trends
by Joyce Mirador
Discover insights into Olist, a Brazilian e-commerce company, through analyzing sales performance, customer behavior, and regional sales distribution. Uncover key trends and strategic opportunities for growth in this comprehensive study.
Objectives
The aim is to identify and understand key trends and patterns across different factors that affect Olist's sales. In exploring the data, the focus is on:
- Assessing product category performance to highlight top revenue-generating and frequently ordered products.
- Analyzing sales trends over time to identify peak periods and understand seasonal trends.
- Segmenting customers based on spending and purchasing frequency to adjust engagement strategies.
- Evaluating regional sales distributions to identify high-performing areas and potential markets for expansion.
⃟⃟⃟
Data Preparation
The dataset, sourced from
Kaggle
and provided by Olist, comprises 100,000 orders made between 2016 and 2018 across various Brazilian marketplaces.
It includes features such as order items, price, payment details, customer behavior and location, and product attributes.
Using SQL, a comprehensive dataset was created by combining relevant tables that contain order, customer, and product
details. During the data cleaning process, about 21% of the data had discrepancies between the total order value and
the customer's transaction value, possibly because the freight value was paid to the logistics partner. As a result,
sales were represented by the total item price.
Another discrepancy was the geolocation data showing multiple latitude and longitude entries for single zip codes,
differing only by 0.01 when rounded. The zip code data was updated by processing the data from back4app.com in
Python
to ensure accurate geolocation information. Other data transformations include deleting null and duplicated values and
converting the order_purchase_timestamp column to datetime format.
⃟⃟⃟
Data Visualization
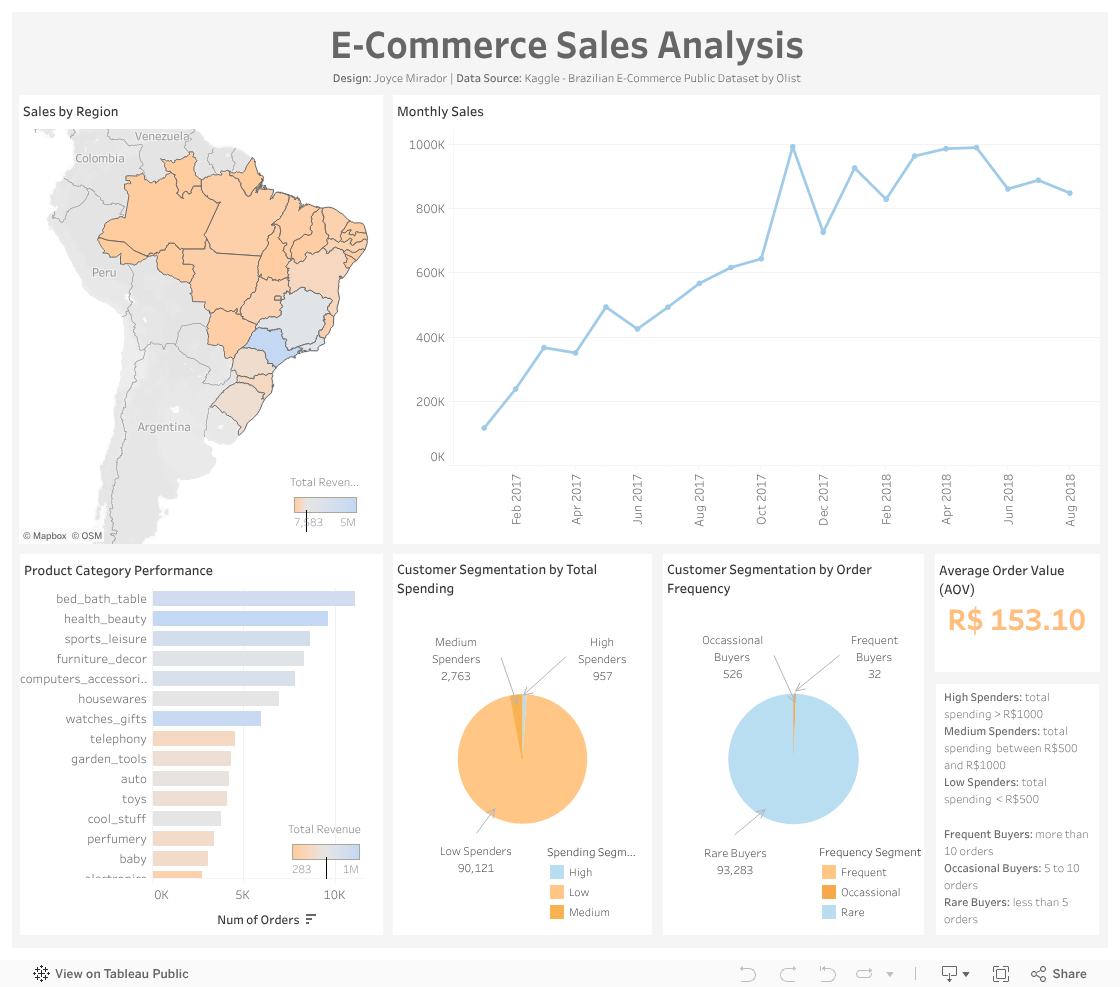
Please see dashboard below.
⃟⃟⃟
Analysis Results
- The highest revenue-generating product category is Health & Beauty, followed closely by Watches & Gifts and Bed, Bath & Table.
- The Bed, Bath & Table category not only generates high revenue but also has the highest number of orders, indicating strong customer demand.
- Sales have significantly increased from 2016 to 2018, with a notable peak in November 2017, likely due to seasonal promotions and holiday shopping.
- Most customers are low-spenders and rare buyers, indicating a large base of infrequent purchasers.
- Rio de Janeiro and Minas Gerais are the top regions for sales and orders, suggesting concentrated demand in these areas.
- Revenue growth is substantial, with a nearly 21% increase from 2017 to 2018.
⃟⃟⃟
Recommendations
To drive growth, Olist should focus on strategies to convert rare buyers into occasional or frequent buyers. Implementing loyalty programs, personalized marketing campaigns, and targeted promotions can encourage repeat purchases. Enhancing marketing efforts in high-performing regions like Rio de Janeiro and Minas Gerais can further boost sales. Additionally, expanding the high-revenue product categories and improving product offerings in the top-selling categories can attract more customers and increase overall sales. Analyzing customer feedback and market trends will also help in refining product strategies and meeting customer expectations effectively.
Dashboard
ദ്ദി(˵ •̀ ᴗ - ˵ ) ✧